Dear All,
Off late, I do constantly hear that people do get burned from the IPO that being launched recently a\in Bursa. They are complaining/whining the current situation for IPO are all bad!
We would like to share some info for all future guidance and perusal:
The Different View between us and Analyst.
The Broking House says:
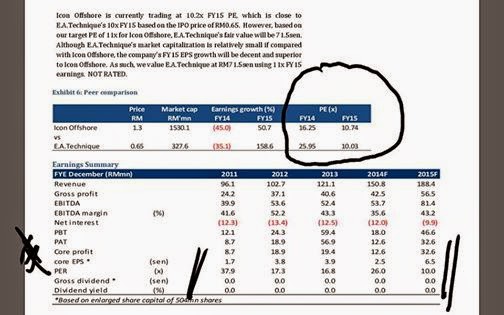
(Extracted from research report published)
Fair Value (FV) = RM 0.715
How to get this FV of 0.715?
*Forecast for Calender Year 2015 (CY) = P/E 11.5
*Forecast for CY2015 EPS = 6.5 cents
*Means forecasting IPO Price/EPS 2015 = 0.65/0.065 = P/E 10
Analysts peg the P/E not 10 but P/E 11 = 0.065 X 11 = 0.715 (2015 FV)
Humble Pie view:
Look at EA Technique Prospectus PAGE 18:
Item: 3.6.1 (iii) says:
For Year End 2013 (FYE 2013), enlarged issue and paid up capital of 504m shares which translates to a P/E 16.7 !
Their latest Audited Report was 2013. Basically they are selling to you the company VALUE PEG at P/E a staggering 16.7x . As posted in my article prior before this:
Why Analysts do not write P/E 16.7 for FYE13 = BUY?
Why Analysts write P/E 10 for FYE15 and posted a Fair Value of P/E 11 for FYE15 = 71.5?
Would you buy if I am telling you I am selling my company to you at 16.7x VS Fixed Deposits guaranteed by PIDM at P/E 18?
Confirmed FYE 2013 EPS = 3.9 cents (Value that you pay for the company)
Estimate FYE 2015 EPS = 6.5 cents (Future value that being estimated for you to pay for the company)
When market is choppy, rarely people will buy the concept of 2 years down the road your earnings shall be VERY GOOD.
Market will just PEG YOU AT MARKET AVERAGE and BUY your shares base on the CURRENT VALUE and NOT FUTURE VALUE.
Closing Price @ 0.475 on 2/1/2015
= P/E 12++ (0.475/0.039)

Let's drill further:
EA Technique Market Cap post IPO = RM327m
Look at average Oil and Gas Companies around RM500m market cap:
Company Market Cap P/E 2013 P/E 2014
ALAM 573m 6.3 7.8
Barakah 621m 12 6.8
Pantech 446m 8 7.5
Perisai 554m 8.9 48 (take it out as it will distort the average numbers)
UZMA 433m 12 11
AVERAGE 9.44 8.275
*EA Technique 327m 16.7 26 (stated in the research report)

Another point to take no is:
Utilization of Proceeds:
Repayment to bank 40.5%
Working Capital 13.4%
Listing Expenses 6.7%
Money Raised for Business Expansion 39%
Means for every RM 1 raised, about RM 0.39 is for business expansion.
At the time of writing, OIL PRICES STILL NOT STABILIZE. I will avoid.

P/S : Maybe I should consider to start a KAMBING GRED A business.
To buy a KAMBING now and to sell the idea to you 25 KAMBING in 2 years time.
(Start counting my 25 KAMBING happily now)
Disclaimer and Declaration
The full content of the article is for educational purposes only and should not be used as investment recommendations. We are not responsible for all investment activities conducted by the participants and cannot be held liable for any investment loss. Examples of specific shares may be citied for illustration purposes.
Regards,
Humble Pie
Off late, I do constantly hear that people do get burned from the IPO that being launched recently a\in Bursa. They are complaining/whining the current situation for IPO are all bad!
We would like to share some info for all future guidance and perusal:
The Different View between us and Analyst.
The Broking House says:
(Extracted from research report published)
Fair Value (FV) = RM 0.715
How to get this FV of 0.715?
*Forecast for Calender Year 2015 (CY) = P/E 11.5
*Forecast for CY2015 EPS = 6.5 cents
*Means forecasting IPO Price/EPS 2015 = 0.65/0.065 = P/E 10
Analysts peg the P/E not 10 but P/E 11 = 0.065 X 11 = 0.715 (2015 FV)
Humble Pie view:
Look at EA Technique Prospectus PAGE 18:
Item: 3.6.1 (iii) says:
For Year End 2013 (FYE 2013), enlarged issue and paid up capital of 504m shares which translates to a P/E 16.7 !
Their latest Audited Report was 2013. Basically they are selling to you the company VALUE PEG at P/E a staggering 16.7x . As posted in my article prior before this:
Why Analysts do not write P/E 16.7 for FYE13 = BUY?
Why Analysts write P/E 10 for FYE15 and posted a Fair Value of P/E 11 for FYE15 = 71.5?
Would you buy if I am telling you I am selling my company to you at 16.7x VS Fixed Deposits guaranteed by PIDM at P/E 18?
Confirmed FYE 2013 EPS = 3.9 cents (Value that you pay for the company)
Estimate FYE 2015 EPS = 6.5 cents (Future value that being estimated for you to pay for the company)
When market is choppy, rarely people will buy the concept of 2 years down the road your earnings shall be VERY GOOD.
Market will just PEG YOU AT MARKET AVERAGE and BUY your shares base on the CURRENT VALUE and NOT FUTURE VALUE.
Closing Price @ 0.475 on 2/1/2015
= P/E 12++ (0.475/0.039)
Let's drill further:
EA Technique Market Cap post IPO = RM327m
Look at average Oil and Gas Companies around RM500m market cap:
Company Market Cap P/E 2013 P/E 2014
ALAM 573m 6.3 7.8
Barakah 621m 12 6.8
Pantech 446m 8 7.5
Perisai 554m 8.9 48 (take it out as it will distort the average numbers)
UZMA 433m 12 11
AVERAGE 9.44 8.275
*EA Technique 327m 16.7 26 (stated in the research report)
Another point to take no is:
Utilization of Proceeds:
Repayment to bank 40.5%
Working Capital 13.4%
Listing Expenses 6.7%
Money Raised for Business Expansion 39%
Means for every RM 1 raised, about RM 0.39 is for business expansion.
At the time of writing, OIL PRICES STILL NOT STABILIZE. I will avoid.
P/S : Maybe I should consider to start a KAMBING GRED A business.
To buy a KAMBING now and to sell the idea to you 25 KAMBING in 2 years time.
(Start counting my 25 KAMBING happily now)
Disclaimer and Declaration
The full content of the article is for educational purposes only and should not be used as investment recommendations. We are not responsible for all investment activities conducted by the participants and cannot be held liable for any investment loss. Examples of specific shares may be citied for illustration purposes.
Regards,
Humble Pie
No comments:
Post a Comment